
Last partial update: September 2019 - Please read disclaimer before proceeding
Over the last 30 years there has been a significant increase in life expectancy in Australia. This is mainly due to a decrease in cardiovascular disease, with the rate of heart attack alone decreasing by a staggering 70% over this period. Life expectancy for a 65 year old increased by about 18 months over that period.
This means that many more people are goig to be able to enjoy their old age and . (When my father was alive the pension started at 65 and the average age at death was 66.)
There has been considerable debate regarding whether this will just mean that people will live longer with significant disability. Luckily this has not been shown to be the case and in fact the period of life with significant disability has been increasing too; with most occurring in the last two years of life.
In 2015, the life expectancy for a 65 year old man was 19.6 years, with 15 of those being lived in full health. For women, the figures are better with a life expectancy of 22.3 years and 16.8 of those years lived in full health.
Preventable disease in Australia
The duration of people’s lives and the degree of disability, both mental and physical, that they endure are very important factors in determining their achievements and their level of happiness. Fortunately Australians have access to a high standard of public health and one of the world’s best health systems and it is thus not surprising that most of us enjoy a long and healthy life.
Life expectancies are continuing to increase and people born in Australia in 2016 have one of the longest life expectancies in the Western world; 80.4 years for men and 84.6 years for women. (This has risen from 51 for men and 57 for women at the beginning of Federation; 1901.) For those aged 65 years in 2016, the life expectancy was 19.6 years for men and 22.3 years for women.
This is mainly due to a decrease in cardiovascular disease, with the rate of heart attack alone decreasing by a staggering 70% over this period.
More recently, this increase in life expectancy has stalled, mainly because most of the easy gains in cardiovascular disease prevention have been achieved.
While unfortunately some of this long life will be spent with some form of disability, better health initiatives over the last 30 years have also reduced the time people live with severe disability before they die. On average in 2011, women spend 9.9 years of their lives with some form of significant disability/ ill health. For men, the figure is 9.0 years. People aged 65 years can expect suffer some form of disability in about 55% of their remaining years and spend about 10% to 20% of their remaining years with a severe disability.
Our long lifespan with many years spent free of disability is probably adequate for most of us to achieve that which we need to / want to in our lives. However, many do not share in this ‘wealth of health’; they die prematurely or suffer unnecessary disability due to diseases that can often be prevented by living a healthy lifestyle. In 2000, 27 per cent of males and 16 per cent of females died before the age of 65.
The aim of this book is to provide the information needed to maximize people’s chance of avoiding preventable illness and thus provide the best chance of achieving a long stay on this mortal coil and staying well while enjoying it.
While this book provides much information that can be used by the individual, it was written with the partnership between general practitioner (GP) and patient in mind, as many aspects of illness prevention require the assistance of a supportive GP. Together, patient and doctor should be able to identify and coordinate the preventative measures required to minimise medical problems. Through regular GP visits, a management plan can be monitored and modified as necessary to address any changing circumstances. All this is very difficult to achieve alone.
Leading causes of burden of disease in Australians according to age (2015) |
|||
| Males | % of total disease burden | Females | % of total disease burden |
| Under 5 year age group | Under 5 year age group | ||
|
|
|
|
| 5 to 14 year age group | 5 to 14 year age group | ||
|
|
|
|
| 15 to 24 year age group | 15 to 24 year age group | ||
|
|
|
|
| 25 to 44 year age group | 25 to 44 year age group | ||
|
|
|
|
| 45 to 54 year age group | 45 to 54 year age group | ||
|
|
|
|
| 55 to 64 year age group | 55 to 64 year age group | ||
|
|
|
|
| 65 to 74 year age group | 65 to 74 year age group | ||
|
|
|
|
| 75 to 84 year age group | 75 to 84 year age group | ||
|
|
|
|
| Over 84 year age group | Over 84 year age group | ||
|
|
|
|
Source: Adapted from Australian Institiute of Health and Welfare Burden of Disease Study 2015
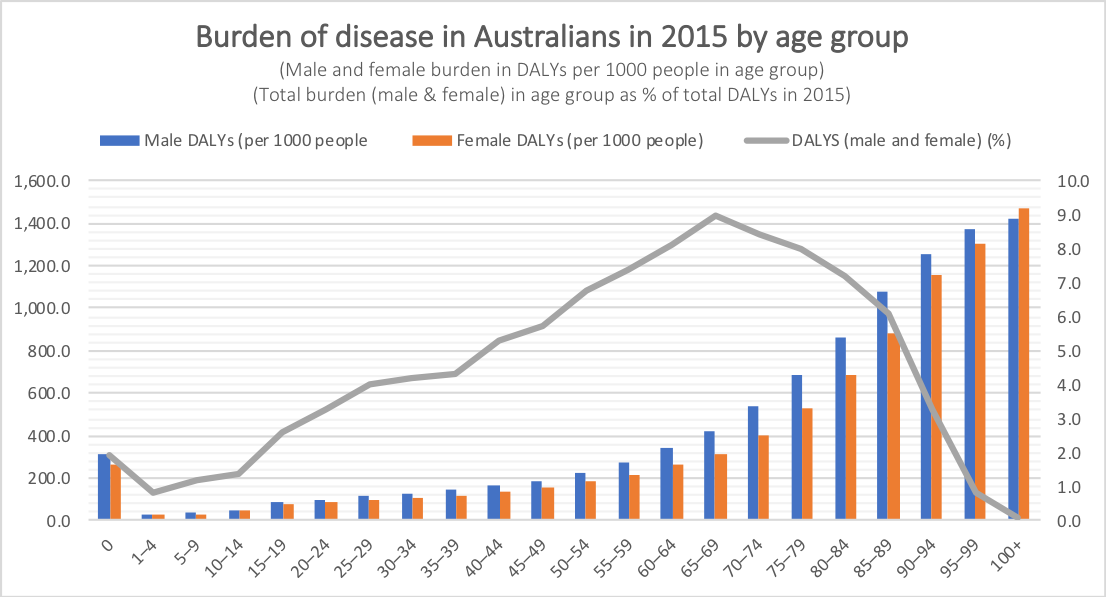
Illness rates through life
As one might expect, disease rates increase throughout adult life; although interestingly you are still at less risk now than when you were in the womb / first year of life. (See graph below.) While the burden of disease per 1000 people continues to increase after the 65 to 69 year age group, the total burden of disease starts to decrease because there are fewer people living.
How much and what type of illness occurs in older people?
As might be expected, people over 65 years of age have the highest incidence of illness. The table below shows the most important illnesses in this age group. (It is worth noting that smoking is a major cause of many of them. Quitting always helps.)
What important illnesses are commonly overlooked in Australia?
- Depression - About 50% remain undiagnosed.
- Diabetes - 50% of cases remain undiagnosed.
- High blood pressure - 50% remain undiagnosed and 25% of those who receive treatment are under-treated
- Heart failure - About 50% remain undiagnosed
- Chronic kidney failure - About 50% remain undiagnosed.
- Osteoporosis - Many people with osteoporosis are unaware they have the condition. (This includes a large number of people with spinal fractures that often occur with minimal symptoms.)
- Hearing loss - Most are undiagnosed.
- Obesity and physical activity - Many people are unaware that they are overweight / do not do sufficient physical activity.
All these illnesses are covered in this web site.
Illness prevention and the GP relationship
There are many preventive health issues that need to be covered in people aged over 65 years. Not only do they need to worry about their present health problems, but they also need to worry about the future and prevent illness in old age. (Not uncommonly, they are also in the situation of looking after ageing parents and are responsible for the health of children and adolescents.) These are detailed below.
Once individuals have worked out which issues they need to cover, they will need to work out how they should best approach dealing with them.
A GP cannot do it by her or him self.
It has been calculated that it would take over seven hours of a GPs’ working day to address properly the preventive health issues of each of his or her patients. This is not possible and thus, if people are going to prevent illness occurring to them, they are going to have to do much of the work.
Luckily, much of this seven hours is taken up explaining the issues involved in maintaining health and this task can be done privately by sourcing appropriate, reliable information. The provision of this information is the purpose of the web site. Below is a guide to the issues that are relevant to preventing illness in people aged over 65. They are all covered in this resource. Keep reading.
What do people need to do with their GP?
This web site acts as a starting point upon which people can build a preventive health program. Each person has different health needs and how individuals use the information in this web site is best decided in consultation with their GP. The required tasks include;
- discussing matters about which the patient requires more information so that decisions can be made
- obtaining help with organising tests etc
- sorting out action plans for lifestyle changes such as weight loss
- referral to other specialists as appropriate
- ongoing management and monitoring of chronic problems, such as high blood pressure, obesity or kidney disease.
Approaching illness prevention - Modifying risk factors
Achieving change
Most people know many of the issues that they need to address but choose not to do so or do so in a haphazard, unhelpful manner. Continually assessing life, deciding on priorities, setting goals to achieve these priorities and planning how to achieve goals is fundamental to living well. Failure to do set aside enough time to do these things (or failure to do them at all) is the major reason for living poorly. This topic is fundamental to good health and is dealt with in detail in the section on entitled Achieving change. Make sure you read it.
Ageing well
Maintaining helpful attitudes to ageing is important to enjoyment and maintaining motivation for life in old age. This topic is discussed at length in the section on Ageing well.
Illness and modifiable risk factors
Burden of disease values have also been calculated for modifiable illness risk factors and it was estimated in 2015 that adopting poor lifestyle health options was responsible for 36% of all burden of disease. (The figure is slightly greater for men and slightly smaller for women.) This is a huge amount. The graph below provides a breakdown of which modifiable risk factors are most responsible for disease burden in both males and females. (Note that the total of all the risk factor burden mentioned in the graph is greater than 36% as some are mentioned twice and there is some overlap as some risk factors act on other risk factors (e.g. physicalactivity acting on obesity)).
Together, these modifiable risk factors are responsible for about;
- 33% of burden of disease due to cancers,
- 85% of the burden of disease due to ischaemic heart disease (heart attacks),
- 27% of the burden of disease due to anxiety and depression,
- 32% of the burden of disease due to injury and
- 60% of the burden of disease due to type 2 diabetes.
Not all of this illness is preventable as these risk factors cannot be completely eliminated. However, by modifying these risk factors people can significantly reduce both premature death and the length of time that they are likely to suffer from disability. Most significant disability occurs in the final twelve years of life and it is estimated that living a healthy life can reduce this period by almost half. Sounds good!
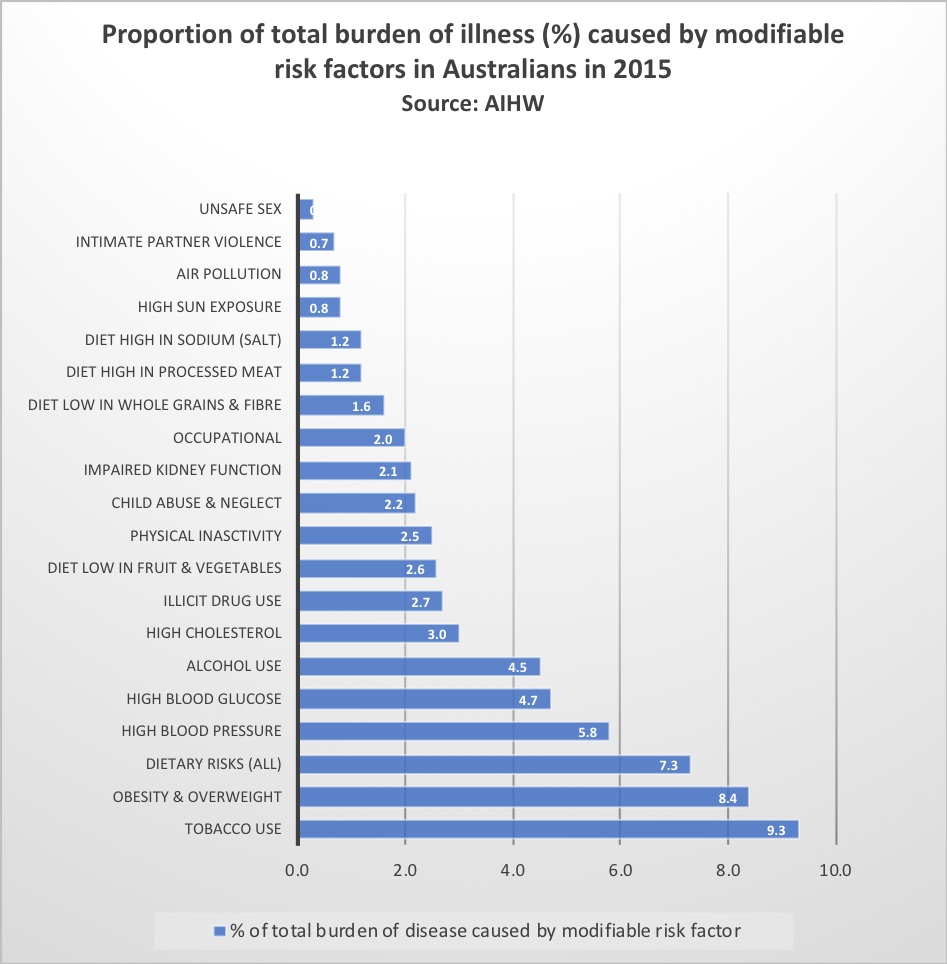
Source: Adapted from Australian Institute of Health and Welfare, 2015
Modifiable Risk Factors - Burden of disease caused in Australians according to age and sex (2015)(% of total disease burden caused in age group) |
|||
| Males | % of disease burden in age group | Females | % of disease burden in age group |
| 0 to 15 year age group | 0 to 15 year age group | ||
|
|
|
|
| 15 to 24 year age group | 15 to 24 year age group | ||
|
|
|
|
| 25 to 44 year age group | 25 to 44 year age group | ||
|
|
|
|
| 45 to 64 year age group | 45 to 64 year age group | ||
|
|
|
|
| 65 to 74 year age group | 65 to 74 year age group | ||
|
|
|
|
| 75 to 84 year age group | 75 to 84 year age group | ||
|
|
|
|
| 85 to 94 year age group | 85 to 94 year age group | ||
|
|
|
|
22 preventative health questions adults need to address
- Do you have a family GP that you see regularly for check ups? When is your next check up due?
- Are your vaccinations up to date? (The vaccination to help prevent shingles (Herpes Zoster) is now free to people in their 70s.)
- Does your GP inspect your body for skin cancers at your regular check ups?
- Does your GP check your urine at your regular check ups?
- Do you know if you are a healthy weight? If you are overweight, have you sought advice regarding reducing them?
- Do you eat well? (See boxed section above.)
- Do you partake in adequate physical activity?
- Have you had an assessment regarding your overall risk of having a heart attack?
- Have you had your cholesterol checked recently? If it was not normal, have you taken measures to reduce it?
- Do you have a healthy blood pressure level? (The target level varies according to overall risk factors for heart disease.) Has it been tested within the last two years?
- If you are over 55 or at increased risk of diabetes, have you been checked for diabetes within the last three years? (People at increased risk of diabetes need to be checked sooner.)
- Are you aware of the symptoms of depression? Is there someone you feel might be depressed for whom you should seek help; yourself, a relative or a friend?
- Are you or is a member of your family being adversely affected by alcohol consumption? Do you consume alcohol at safe levels and have at least two alcohol free days each week? Do you pass the AUDIT alcohol test?
- If you smoke or take illegal drugs, have you looked into stopping them? If you smoke, have you had your lung function checked? Smoking is probably already affecting your breathing ability, making you short of breath, and greatly increases your risk of heart attack and lung cancer.
- Do you spend time each day thinking about issues relating to improving relationships with family and friends?Do you suffer abuse in your relationship? If so, you need to tell your GP. (See Relationships section)
- Do you have a family medical history that may increase your risk of any disease, especially cancer, heart disease, diabetes, cystic fibrosis, thalassaemia or haemochromatosis? If so, have you discussed this with your GP.
- If you are over 50, do you have a screening check for blood in your bowel motions at least second yearly (a faecal occult blood test)?
- If you are female and have had sexual intercourse, do you have regular Pap smears?
- If you are female and over 50, do you have mammograms every two years?
- If you are female, have you discussed osteoporosis with your GP?
- Have you assessed your work and hobbies with regard to any specific health risks they may pose?
- Do you take precautions to protect your hearing when exposed to high noise levels? Hearing loss is the seventh most important cause of illness in men and the eleventh in women.
Important preventive health issues for people aged 65 years and over
While it may appear that this is a long list, please take the time to go over the complete list. While most people only have a few issues they need to deal with, they may not realise the importance of some issues and others may not have been previously considered at all.
Lifestyle change (the most important topic)
Lifestyle change. Most people are aware of many of the things they should do to improve their health but are either unsure how to approach achieving them or are unable to successfully implement appropriate changes. This section aims to provide the information you need to successfully implement change in your life. It is essential reading.
Cardiovascular disease
- Vascular disease prevention counseling. This should include assessment of risk factors for cardiovascular disease to work out overall risk of cardiovascular disease. This enables people to be sorted into low, medium and high risk groups with respect to their risk of having a heart attack. All the risk factors below should be addressed.
- Cholesterol All patients should have already had several screening blood test for cholesterol. Assess second yearly in low risk individuals and yearly in high risk individuals.)
- Blood pressure High blood pressure is common in older people and reducing it significantly reduces heart attack risk. Checks need to be done at least yearly.
- Diabetes All patients over 55 years of age should have already had several screening blood test for diabetes. People at increased risk of developing diabetes need to start having screening tests earlier; some as young as 35 years of age. Once screening commences, tests should be done at least every 3 years and yearly for those at high risk or who have had an abnormal test in the past.
- Smoking People aged 45 to 65 are in the age group that heart attacks and strokes start to commonly occur. Smokers who quit will significantly reduce their risk of death.
- Weight. Reducing obesity reduces blood pressure and insulin resistance (i.e. the risk of developing diabetes) and both these are significant causes of heart attacks. Obesity is also related to several cancers. Check with a GP to see whether weight loss would be beneficial.
- Exercise Exercise is important for prevention of numerous illnesses, including heart attacks. Moderate exercise for 30 minutes at least five times a week is the recommended minimum. (Increase exercise to this level should be done gradually.)
- Stroke prevention This basically involves reducing risk factors for cardiovascular disease. Sometimes minor or transient stroke symptoms can be missed and thus it is worth asking about these at each check up in those who are over 55 years of age and at high risk of having a stroke, which includes people:
- at high risk of cardiovascular disease
- with atrial fibrillation (A type of abnormal heart rhythm.)
- What should I do if I have already had a heart attack? People who have already had a heart attack are already at high risk of another and this section sets out how this can best be avoided.
- What should I do if I have a strong family history of heart attacks? People with a strong family history of heart attacks are at increased risk and need to take special precautions. They also need to find out if they have a inherited condition that has caused this increase in family heart attack incidence.
Cancer
- General concepts regarding cancer prevention Reducing cancer involves preventing it occurring, screening for early cancer, looking for early symptoms of cancer. There are important concepts that people need to be aware of regarding these prevention strategies.
- Colorectal cancer. This cancer is common in both men and women. Screening for this common cancer (by testing feces samples for the presence of blood every second year) should have been started at age 55 years and can be continued to age 75 years. Those at high risk may need earlier screening.
- Breast cancer. Screening for this common cancer (by mammography every second year) should have been commenced at age 50. It can be ceased at age 70 but benefit still exists past this age. Breast checks should be done by a GP at each check up.
- Cervical cancer Screening for cervical cancer with Pap smears should have been common practice for many years for all women who have been sexually active in the past.
- Skin cancer All skin cancers, including melanoma are common in this age group and an annual skin check is wise.
Mental health
- Anxiety and depression (and suicide) Anxiety and depression are common throughout life and are still important issues in this age group.
- Alcohol Excessive alcohol use is often still a significant problem in this age group, especially in males.
- Relationships Relationships with family and friends are the cornerstones of human existence. People who are having problems with important relationships in their life should deal with them sooner rather than later. The longer such problems exist, the harder they are to fix.
- Dementia Like falls, dementia is associated with the end of life and something which is often avoided. Prevention in most cases is difficult, although a significant number of cases are due to vascular disease in small vessels causing the death of multiple small parts of brain tissue. Minimising risk factors for cardiovascular disease will help prevent this process. Dementia is important to diagnose as organising adequate supports at home and in the community will help the person stay independent longer and will prevent helper ‘burn out’.
Fracture prevention
- Fall prevention in the elderly This is commonly a concern that older people avoid, mainly as it is a sign that they are now old. However, it is a really important issue for those over 65 years of age, causing much disability and loss of independence; the last thing that most old people want. Yearly checks for factors that are likely to make falls more likely are very worthwhile. (Checks should be done six monthly in those who have already had a fall.)
- Osteoporosis prevention and diagnosis / treatment Osteoporosis is very common in older people, especially women, and is often undiagnosed and under treated. All people in this age group need to be aware of this condition and how to avoid / treat it.
Other preventive health issues
- Hearing impairment - Hearing is a precious sense that needs to be protected. Unfortunately it is something that we take for granted and a huge number of people, especially men, suffer from hearing impairment due to excessive noise exposure throughout their lives. Hearing loss is the seventh most common cause of illness overall in men, ahead of well-recognised illnesses such as prostate cancer, colon cancer and road traffic accidents. I can not count the number of times I have driven past men mowing lawns without any hearing (or sight!!) protection. Not being able to hear music or loved ones properly is a huge burden to bear later in life. Please read the section on hearing loss.
- Loss of vision:
Loss of vision should be checked for at least every five years from the age of 50 years and there are some people who need more regular and special sight checks. These include people with:
Eighty percent of visual impairment is caused by five conditions: macular degeneration, cataracts, refractive error, diabetes and glaucoma. Visual loss from cataracts and refractive error can be completely avoided or successfully treated in most cases. Loss of vision from chronic glaucoma can also be prevented as long as it is found early on. Damage that has already occurred can not be repaired. Only macular degeneration can not be significantly helped. Quitting smoking can help reduce visual oss in old age due to retinal damage.➢ Diabetes (Need at least yearly checks with an eye specialist.)
➢ People with a family history of chronic glaucoma - Medication practice and illness Despite much recent effort to reduce illness associated with medical practice, complications, side effects and mistakes still unfortunately occur. There is much that people can do to protect themselves, especially in the area of medications. (There are special concerns with the administration of medicines in older people that are dealt with in a separate section. See below.)
- Safe use of medication in the older people Several factors make safe use of medications more difficult in older people and there are medications that are used fairly commonly that would best be avoided if possible. (See section below.)
- Immunisations Immunisations are important in all age groups.
- Kidney disease Routine testing of urine at each check up should be done to help detect kidney (and other) disease.
- Dietary issues Adults are responsible for household meals and it is important that they are aware of what constitutes a healthy diet; especially if the current obesity epidemic is to be beaten.
- Osteoarthritis
Pain due to joints wearing out obviously can not be easily prevented at this late stage. However, pain can be relieved and interestingly, a well structured exercise program can actually reduce symptoms. And weight reduction is always beneficial.
Burden of disease
The table below shows the 20 leading causes of death and disability (or burden of disease) in Australia, most of which are significantly preventable. The figures used in this book to grade the death and disability caused by each illness are derived from information gathered and interpreted by the Australian Institute of Health and Welfare (AIHW). When assessing the importance of an illness, the AIHW does not just to look at its incidence. It also measures carefully the extent to which the illness causes premature death and the length and degree of disability the illness causes. Diseases that on average occur earlier in life, and thus cause earlier deaths or lengthier periods of disability, are given a higher rating. Both the disability and death caused by the particular illness are given a value in terms of years of healthy life lost, and, when added together, give an overall ‘burden of disease’ rating for the illness; expressed as ‘disability-adjusted life years or DALYs. The use of DALYs allows a comparison of the harm caused by all illnesses, whether they cause predominantly death or disability.
At present (2019) about 360 illnesses and 80 risk factors for illness are assessed in this manner. To ensure this colpex task is done accurately requires a staff of hundreds of people and a huge amount of time. Thus, assessments are only at infrequent intervals and usually are released several years after the information is gathered. (This can mean that it looks a bit out of date but medicine really changes slowly and being accurate is of paramount importance as National health policy (and funding) is determined by this data.
In 2015, the burden of disease was equally distributed between years of life lost due to death and years of life lost due to disability.
What are the most common causes of illness in Australia?
The leading causes of burden of disease in Australia (2015) |
|||
Cause - Males |
% of total burden of disease |
Cause - Females |
% of total burden of disease |
Coronary artery disease (heart attacks) |
8.6 |
Coronary artery disease |
5.0 |
*The figure for alcohol combines the harmful effects, which mainly occur in younger people, with the beneficial cardiovascular effects which occur mostly in older people. |
|||
(Back to top)
Medication - Safe use in older people
Medication use by older Australians causes much illness with between 85,000 and 110,000 Australians over 65 are admitted to hospital each year because of adverse reactions to prescribed drugs. Problems are related to both the number and kind of drugs taken.
Why is care needed in prescribing for the elderly? Here are some reasons?
- A recent study suggested that in 2005 over 400,000 Australians over the age of 70 years were prescribed a drug that is potentially inappropriate for use elderly patients.
- There is little evidence about the effects of medication in older people, who represent only about 3% of participants in well conducted studies of medications. Unfortunately extrapolating results to older people does not always give an accurate picture of likely benefits and adverse reactions.
- Generally speaking, adverse reactions are more significant in elderly people, who are four times more likely to be admitted to hospital because of an adverse drug reaction. It is thought that about half of drug reactions that occur in older people could be prevented by better prescribing.
- Adverse drug reactions are less likely to be reported on in older people and are often misdiagnosed as a medical condition. Medications should always be suspected as the underlying cause of falls and confusion in older people and should be thought of as a possible cause in almost all new illness in older people. (Medications are the cause of about 10% of cases of chronic confusion and dementia.)
- Increased risk of toxicity is a problem in older people, occurring mainly due to kidney and liver abnormalities that reduce the ability of the body to metabolise or excrete the medication.
- The prescription of five or more medications (termed polypharmacy) is common in older people; the incidence is about 20% to 40%. (While in some cases polypharmacy is necessary, the main risk factor is the prescribing doctor.) Polypharmacy is associated with several problems including:
- 3 to 4 times the incidence of adverse reactions (up to 80% of people on 6 or more medications)
- a doubling of the risk of falls
- increased incidence of prescription error (incidence to 35% or more)
What can be done to make medication use safer in older people?
1. Make sure that you keep an up to date list of all the medications you are taking (with doses)
2. Make changes gradually and monitor the patient carefully when changes are being mad:
- Try to only change one medication at a time
- Start with low doses (often less than half the normal adult dose is appropriate) and increase the dose gradually if required.
- Patients should report any adverse reactions to their medication promptly
3. Simplify medication by when ever possible:
- avoiding polypharmacy
- using medications that require single daily doses where possible
4. Where polypharmacy already exists, doctors can try to reduce the number of medications being taken.Where polypharmacy exists, it is often worth considering reducing the number of medications being taken. Several studies have shown that this can be done without consequence in appropriate situations. However, this depends on the medication and the situation and It is VERY IMPORTANT that this is coordinated by the person's doctor. Stopping some medications can be dangerous and it is not something a person should do without consulting their doctor. Gradually reducing the dose rather that abrupt cessation can help reduce the likelihood of problems and make patients (and doctors) less worried about possible consequences.
5. Avoiding where ever possible medications that are more likely to adversely affect older people
There are numerous medications that are likely to cause problems when given to elderly patients. The main adverse reactions these medications cause are:
- confusion and drowsiness, which cause difficult behaviour and increase the risk of falls. These effects are mainly caused be drugs acting on the brain (sedatives, medications for depression, antipsychotics)
- a postural drop in blood pressure which causes dizziness and thus an increased likelihood of falls
- exacerbation of chronic kidney failure (Mild to moderate chronic kidney failure is common in elderly people, especially women, and often causes no symptoms and thus remains undiagnosed.) Arthritis medications can cause this problem.
- nausea and vomiting
- haemorrhage due to the use of anticoagulants, such as aspirin and warfarin, and arthritis medications
Important groups of medication that cause the above and should be used warily in elderly people include:
|
Researchers in the USA have established criteria for determining which medications are 'Potentially Inappropriate Medications for the Elderly; the 'Beers' criteria.
A list of medications produced in 2003 can be accessed from the following web site. (Some of these are not available in Australia.) http://www.americangeriatrics.org/files/documents/beers/BeersCriteriaPublicTranslation.pdf
Methods of reducing difficult behaviour resulting from disorientation in older people without using medication
|
(Back to top)